Most businesses already understand the importance of content marketing as a way to raise brand awareness, enhance search engine visibility, establish authority and increase lead generation. However, many marketers have little to show for their efforts, and this is often due to not paying enough attention to the statistical data gathered from their digital marketing efforts.
If you feel that your content strategy is taking you on a road to nowhere, you will need to take every available step to find out exactly what is holding it back. Perhaps your content is not compelling enough to keep people on the page. Maybe your calls to action are not clearly visible enough or, perhaps, it is not presented in an accessible enough format for it to reach a large enough audience. Whatever is holding your content strategy back, you can uncover all by studying the analytical information generated by your online resources.
Making sense of the wealth of data generated by digital marketing may seem like a daunting task but, to make it easier for you to identify the most important statistical information, this guide breaks it down for you into clearly defined categories. By studying these key performance indicators, you’ll be able to learn where your content strategy is succeeding and, more importantly, where it’s holding you back.
Below are some of the performance metrics we track for our clients’ content marketing campaigns over at Sandstorm Digital FZE…
Consumption Metrics
Every piece of content published should have a goal behind it. This goal may be to build brand authority, increase recognition, generate leads or even to sell a particular product. Content consumption refers to the very first step in the journey that a member of your target audience takes towards fulfilling that goal. Consumption metrics allow you to determine the reach of your content:
- Page view analytics show you the number of people who have visited a blog post, webpage or watched an online video. In the case of email marketing, the equivalent metric is open rate.
- Unique visitor analytics show you how large your audience is as well as give you some insight into repeat visitors. This metric is more important than page views alone, since it gives some insight into your reader retention rate too.
- The average time spent on the page gives you an idea of how much time people are actually spending digesting your content. Obviously, the more time people spend viewing your content, the better.
- Page depth refers to the number of pages visited each time a visitor comes to your website. If visitors are typically only viewing one page before leaving, you might not have enough interesting or relevant content to hold their attention.
All of the above statistics are readily available using Google Analytics or any other similar tool. If you have any gated content locked behind a registration form, you’ll also want to track its consumption metrics. Tracking the consumption rate of other forms of content, such as that posted on social media, is a bit more complicated, although you can still measure click-through rates, particularly if you use a URL shortener like bit.ly.
Retention Metrics
While getting your target audience to notice your content is the first part of the battle, the next step is to hold onto them. Successful blogs, YouTube channels and social media brand pages, for example, hold onto a regular audience. Comparing both consumption and retention analytics will give you some important insights into how interested and engaged your target audience is with your content.
- The percentage of new and repeat visitors provides some very useful insights, and you’ll need to work hard to find the right mix. For example, a large number of new visitors, but relatively few repeat ones, may be down to sporadic, infrequent content updates.
- The bounce rate refers to the percentage of visitors to your website who leave within a few seconds of arriving. A high bounce rate might point to slow loading times, excessive on-site advertising, poor navigation or content that is not related to what they were expecting.
- The frequency of return visits gives an insight into the level of commitment your repeat visitors have to your content. As a general rule, more frequent visits point to a more engaged audience that has come to expect regular updates.
Again, the above statistics can all be tracked using Google Analytics. Some of these metrics don’t apply to all types of content, including assets such as application or e-book downloads. Concerning email marketing, you can track subscriber retention habits by monitoring your unsubscribe rate, although this tends to be a very inaccurate metric due to the fact that many people don’t bother unsubscribing from newsletters. The major social networks also provide insights into things like repeat visitors and follower growth.
Engagement Metrics
A successful content marketing strategy draws in a large audience and enjoys a high retention rate, but when people actually start engaging with your content by way of comments and shares, things really start to get exciting. Content that is shared and talked about on social media and through other channels tends to be very successful, even to the point that it can receive viral exposure. When a particular piece of content reaches this stage, your target audience are effectively promoting your brand and its content for you.
- Social media shares point to the number of times a particular piece of content, whether it’s a blog post, video or anything else, is shared on Facebook and other social media sites. If someone finds your content interesting enough, they’ll likely want to share it with their friends. Similarly, you can often track forwarding rates for email newsletters.
- Comments on social media, on blog posts and other online portals can provide invaluable customer feedback, although it should not really be considered as a metric in the normal sense, since social chatter can take place in many forms and on many off-site platforms, making it difficult to track accurately.
- Organic inbound links are links to your website that you didn’t ask for. Attracting organic links is a key element of search engine optimization, since they act as an endorsement for your website. After all, it’s always a good sign if someone enjoys your content enough to share it on their own website. You can explore your website’s link profile using a free tool like Open Site Explorer.
The above metrics can be difficult to track, but more important is to keep a close eye on social media chatter and on-site comments to learn more about the needs and desires of your audience and how well they are reacting to your content. In general, however, the more people are engaging with your content, the better.
Lead Generation Metrics
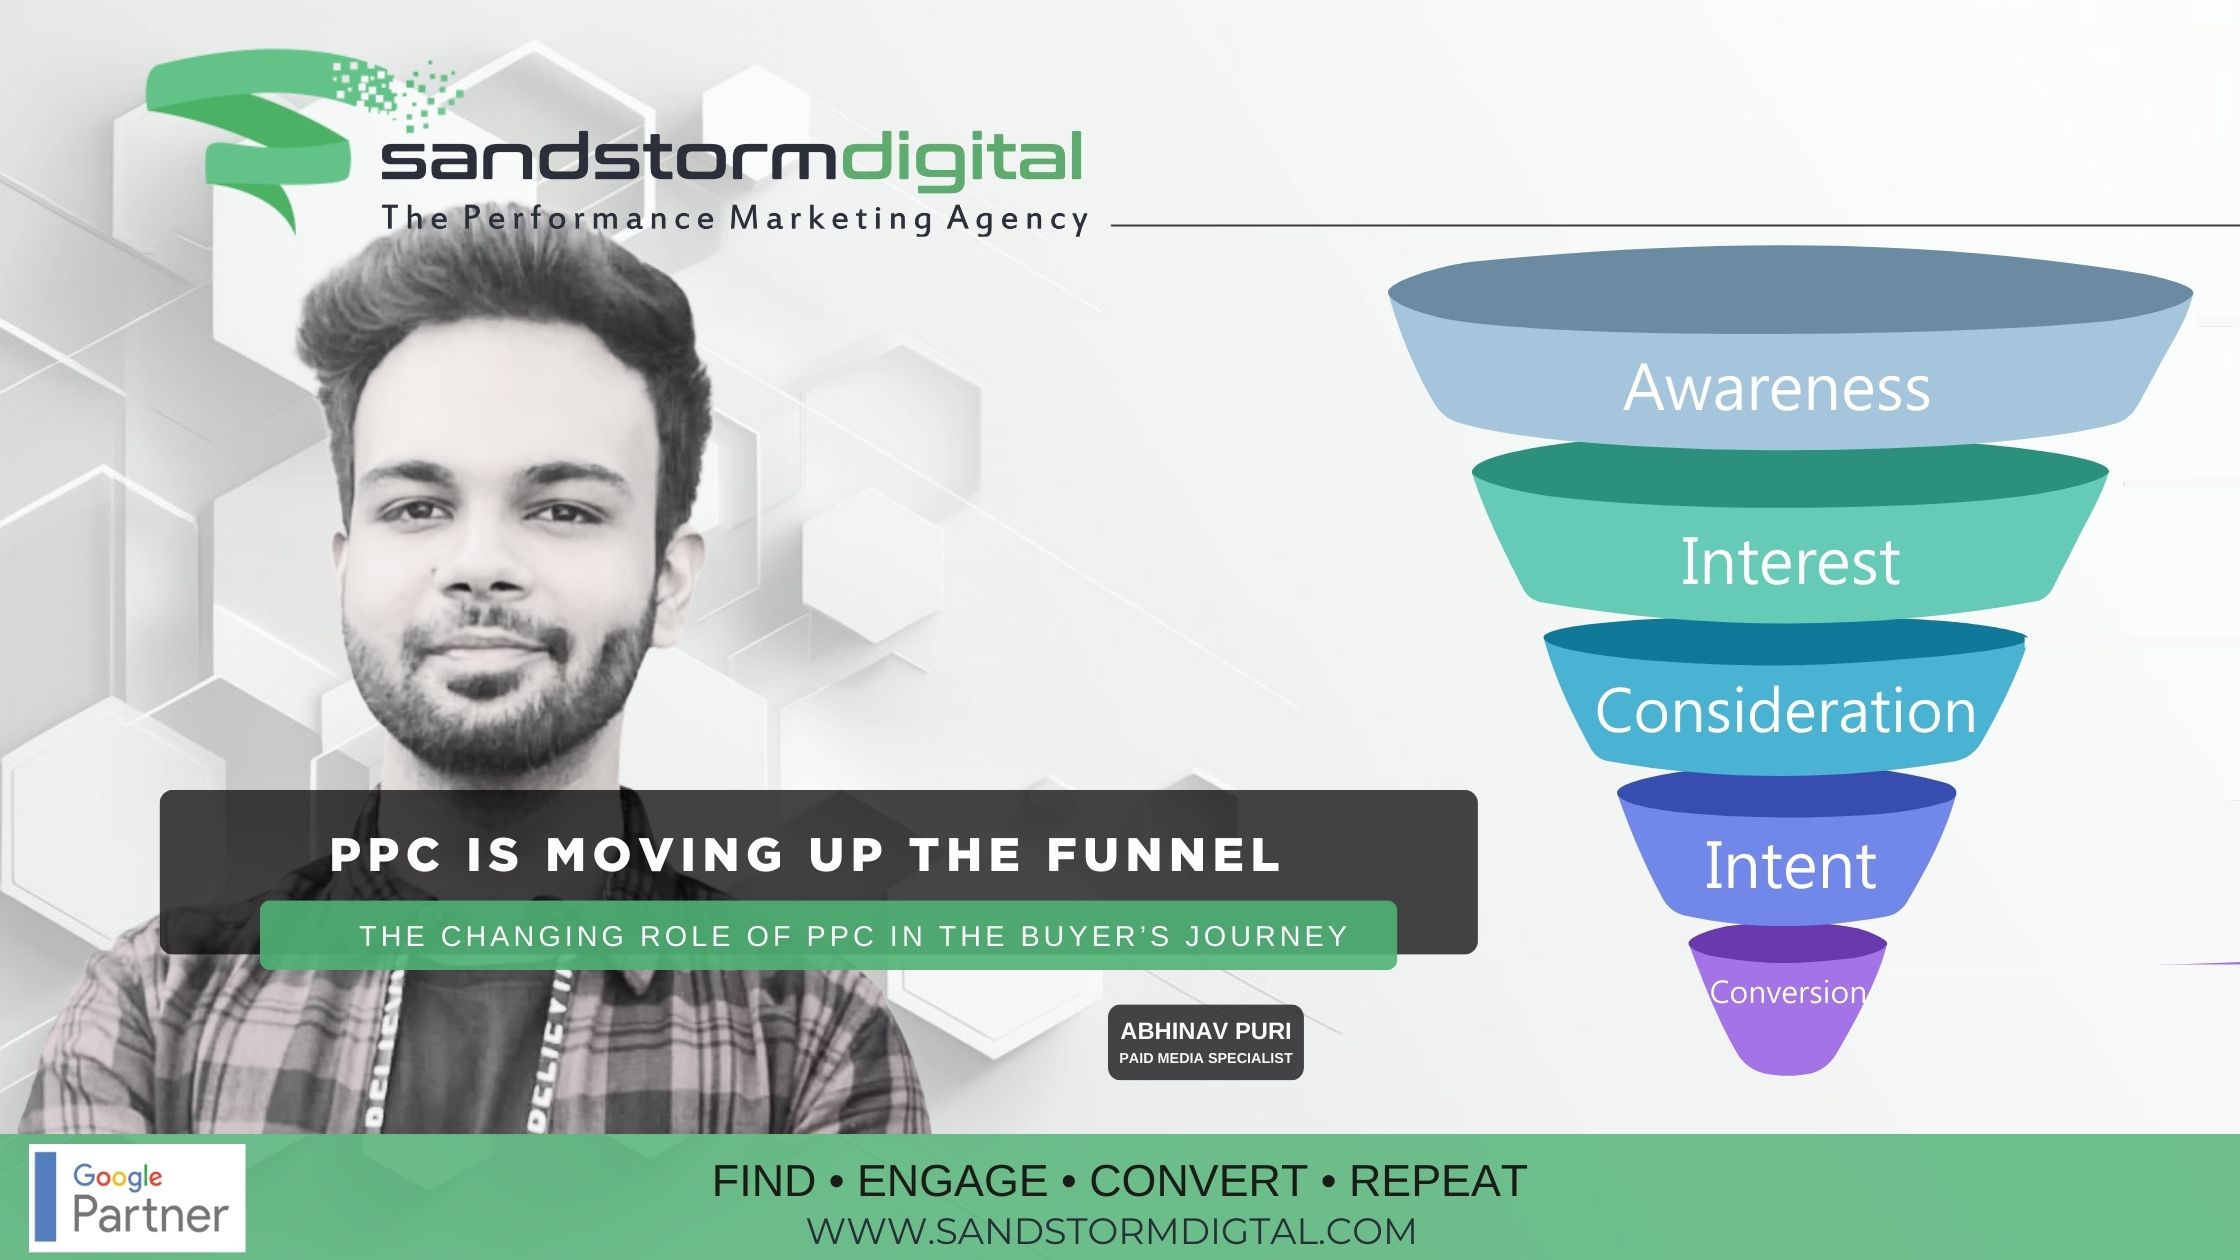
The next step in the conversion funnel is lead generation, whereby your content has already succeeded in drawing in and retaining a targeted audience to such an extent that they make something of a commitment to your brand, even if they ultimately decide not to buy anything. Quite often, lead generation is the main goal of a piece of content, particularly in the case of B2B industries.
- Form completions and application or e-book downloads, particularly those that are gated behind some kind of a sign-up procedure, show an increased level of interest in your brand to the extent that signups may be considered promising leads towards becoming future paying customers.
- Email newsletter subscriptions, provided that they are entirely transparent and opt-in-only is often a primary goal of certain content. You can easily track the number of signups using the analytical tools from your email service provider.
To get a better idea of your return on investment after you have also determined the conversion metrics, you’ll want to assign a value to key behaviours, such as email newsletter signups. It’s also a good idea to set up custom goal-based reports for each content category.
Sales Metrics
The ultimate goal of any kind of marketing strategy is, of course, to sell something. Content marketing ultimately exists to help your brand grow, and what you really need to know, particularly given the time and effort involved in creating and publishing content, is if it’s actually making you any money. By tracking your sales metrics, you’ll be able to find out how your content is impacting your business’s overall customer acquisition goals.
- The number of online and offline sales directly resulting from your content. You should be able to track online sales through your e-commerce platform, but tracking offline sales and relating them to your content marketing strategy is rather more complicated. In these cases, you’ll need to do some manual reporting and study customer feedback.
- Tracking the amount of revenue generated by sales resulting from your content allows you to determine your return on investment and the cost per customer acquisition. You’ll also want to divide this statistic among specific groups or individual pieces of content to get a better idea of which content is most successful in leading to conversions.
Insofar as your content marketing strategy is concerned, you’ll need to segment each area of your campaign to learn which formats and content types are working best. For example, your blog might be driving lots of sales, while your email newsletter strategy may need work to generate a satisfactory return on investment.
Final Words
Measuring content marketing is a lengthy but essential process, but with a carefully planned strategy in place and a thorough understanding of which metrics to track, you’ll be able to adapt the planning, production and distribution of your content to better meet your business’s goals. To summarize what you ultimately need to find out, consider the following points:
- The value your content delivers in terms of time and money spent on it.
- The reach of your content and its impact on your authority and reputation.
- A quantifiable measurement of your return on investment.
Over to you…
How do you track content performance? Share below…


